
The developer must either provide the logging and attach a debugger or go get fucked when a runtime error happens
are you c++?
You can also debug post-mortem with the minidump or the core dump file with WDT on Windows. Great fun and a good way to brush up on your assembly skills
Great fun and a good way to brush up on your assembly skills
Just load it on the debugger and leave your asm skill gather patina.
That’s not true though. You can get the backtrace and other useful information from the coredump mentioned by the error message by loading it with gdb. Not as good as attaching it to a living process, since you can’t see step-by-step what happens leading up to the error, but still quite useful.
Well yes, that’s a pretty good way of debugging a third party app but if you are developing something you can have more ease with gdb attached
let’s not act like Java’s error log is useful
It actually is if you known how to read it. It’s extremely verbose, but you can follow any exception down to the exact line of code (or JNI call, I guess) where the problem occurs. I’ll gladly take the kilobytes
Unfortunately, Java programmers seem to hate actually handing errors, so you see a lot of
try{} catch (Exception e) { throw System.println("something went wrong");}ruining your life, but that’s not the language’s fault.but you can follow any exception down to the exact line of code (or JNI call, I guess) where the problem occurs.
But, it’s not really where the problem occurred. How often do you get a stack trace and the bug fix is at the line referenced by the stack trace? Almost never. It’s more that it takes you down to the exact line of code where the effects of the problem are bad enough to affect the running of the program. But, the actual problem happened earlier, sometimes much earlier.
For example, NullPointerException isn’t actually the problem, it’s a symptom of the problem. Something didn’t get initialized properly, and nobody noticed for a while, until we tried to use it, and got a null pointer. Sometimes it’s easy to go from the effect (null pointer) to the cause (uninitialized thing). But, other times that “thing” was passed in, so you have to work backwards to try to figure out where that thing comes from, and why it’s in that broken state.
Sure, it’s better than nothing, but it’s still frustrating.
When reproducing a bug? Most of the time. Reasoning back from the variable name and location of a null dereference with a provided call path is much more than you get with tons of languages, especially when calls from frameworks or external libraries enter the mix.
It won’t tell you exactly what to fix, you’ll need to debug for that (C# does some black magic to allow you to do that, Java doesn’t come close to the capabilities of full fat Visual Studio), but you won’t need to waste any time deciphering where the program crashed.
Every crash is frustrating, but the stack traces themselves are super useful.
Super-advanced java devs like me do it like
try{} catch (Exception e) { System.out.println("something went wrong); e.printStackTrace(); }And then swallow the error, continue executing the code, and make others wonder why the program printed 40 stack traces but crashed without one.
On Error Resume Nextnever before have more terrible words been spoken.On Error Resume Nextnever before have more terrible words been spoken.Every time I’m reading a PowerShell script at work and see
-ErrorAction SilentlyContinueI want to scream into a pillow and forcefully revert their commit.I’ve actually done it a few times, but I want to do it every time.
And that’s why you’re a hero.
Yeah cos everyone knows other languages are impossible to write bad code with
you can follow any exception down to the exact line of code
Which is usually not a piece of code written by us and is caused by another piece of code not written by us either
Does your IDE not highlight the lines written by you in a different colour? Of course that doesn’t help when it’s an error in production!
Is it possible to make intelliJ do this?
I thought it highlighted the line number in blue when it was your code. I use eclipse so can’t properly remember
I don’t know any programming language where that isn’t the case, though. Unless you’re writing another SerenityOS, you’ll probably use external frameworks and libraries to take care of all the uninteresting stuff.
It’s extraordinarily useful
skill issue
The same applies to using the core dump.
In fact, the Python one is the lest useful of the trio.
When the day comes that you need
gdbyou will indeed be amazed at how fucking powerful it is. If your server crashes grab that core dump!
I think it’s pretty useful, be interested to hear your hangups with it though because it’s definitely not perfect.
If something goes wrong and I have a stack trace, that plus the type of exception will almost always be enough for me to figure out what’s wrong at least as a starting point. I’ve worked mostly with JVM languages in my career though so maybe I just don’t know how bad it actually is.
My favorite compile error happened while I was taking a Haskell class.
ghc: panic! (the ‘impossible’ happened)
The issue is plainly stated, and it provides clear next steps to the developer.
I had a similar error, though not from the compiler
Error message just readthis should never happenAh, good old PlarformIO
Except the C++ “Core dumped” line is telling you it just wrote a file out with the full state of the program at the time of the crash, you can load it up and see where it crashed and then go and look at what every local variable was at the time of the crash.
Pretty sure you can even step backwards in time with a good debugger to find out exactly how you got to the state you’re currently in.
Where does it write the file
If you are using systemd, there’s a tool called coredumpctl.
Nobody knows
deleted by creator
On a secret FBI server somewhere where they watch your failures and laugh
deleted by creator
tl;dw: writes to the path in
/proc/sys/kernel/core_patternI believe it’s
/var/lib/apport/coredumpon Ubuntu.imagine if it, like, told you this so you didn’t have to find out about it via a post on lemmy
i mean you’re expected to know the basic functioning of the compiler when you use it
Imagine if you knew the most basic foundational features of the language you were using.
Next we’ll teach you about this neat thing called the compiler.
I’m not a C/C++ dev, but isn’t
apportUbuntu’s crash reporter? Why would dumps be going into there?Though on a rhetorical thought, I am aware of systemd’s
coredumptctlso perhaps its collecting dumps the same way systemd does.https://wiki.ubuntu.com/Apport
It intentionally acts as an intercept for such things, so that core dumps can be nicely packaged up and sent to maintainers in a GUI-friendly way so maintainers can get valuable debugging information even from non-tech-savvy users. If you’re running something on the terminal, it won’t be intercepted and the core dump will be put in the working directory of the binary, but if you executed it through the GUI it will.
Assuming, of course, you turn crash interception on- it’s off by default since it might contain sensitive info. Apport itself is always on and running to handle Ubuntu errors, but the crash interception needs enabled.
Ah I see, that’s actually pretty cool - thanks!
imagine if it like, read that file and gave you a stack trace
gdb gives you waaaaaaaaaaaaaaay more than a stack trace.
I love gdb! I recently had to do a debug and wow its so cool! On gentoo I can compile everything with symbols and source and can do a complete stack trace.
Am I the only one in this thread who uses VSCode + GDB together? The inspection panes and ability to breakpoint and hover over variables to drill down in them is just great, seems like everyone should set up their own c_cpp_properties.json && tasks.json files and give it a try.
…unless you build the executable with optimizations that remove the stack frame. Good luck debugging that sucker!
Nevermind that the C++ program is two orders of magnitude faster when completed.
I would love to learn and use Rust but I’m a embedded systems guy. Everything of consequence is C and C++.
There’s embedded rust for a few platforms. Using it on ESPs is fun
Rust seems pretty performant
https://benchmarksgame-team.pages.debian.net/benchmarksgame/fastest/rust-gpp.html
I meant faster than Python, not faster than Rust. Rust is fast.
If the embedded system is old or poorly-maintained enough, there might be more Rust than you’d think.
Rust developer: I’d like to compile some code
Rust compiler: the fuck you are
The rust compiler holds your hand, wraps you in blankets, makes you hot chocolate, kisses you on the forehead before it gently and politely points out what you did wrong and how you can solve it step-by-step. It would never think of something as heinous as swearing at you, shame on you for insulting my wife’s honour like this.
I don’t know from where this legend comes from but lifetimes/concurrency/macros errors are brain-hurting.
Most of the time I find myself dropping project because I wrote my program in a correct way but Rust just does not like how it is designed lol. I can’t get shit done with this language
Rust compiler is passive agressive, like:
“There’s an error at line 286 because you still don’t know how to use the borrow checker after all this time ♥️”
its a compiler. That is at best projection, especially considering how the compiler’s error feedback is designed to be firm yet gentle.
except when it gives errors about lifetimes of some object.
boy, that makes my brain hurt
The rust compiler produces a flawless understanding of your code, and then quits out because understanding that code is a Nightly-only feature and you’re using the stable build.
Damn right. And once it compiles… it works.
Meet my friend: .unwrap()
Fair.
I need a rust compiler in my life 😍
Joke on you until the python program segfaults
If it does it’s because of C/C++ code
Python: So you used spaces and tabs for indentation? NOW DIE!
Good. Spaces and tabs for indentation should never be mixed in any language other than Whitespace.
Raw adjust with tabs, fine adjust with spaces.
Don’t laugh, people are actually doing that.
Some people use tabs for indentation and spaces for alignment. It kind of gets the pros of tabs (user configurable indent-width) and the pros of spaces (alignment). That doesn’t work in Python where you can’t align stuff and the interpreter doesn’t allow mixing tabs with spaces, but in other languages it is a possible style.
There are no pros to tabs. Configure tabs to a number of spaces.
Mixing tabs and white spaces in 2024 is categorically a you problem lmao
Mixing spaces and tabs should be a warcrime.
Find me anyone who claims they use tabs for indentation, and I bet I’ll find at least one case where they’re using both tabs and spaces.
The only safe way to avoid war crimes is to avoid tabs.
Why would I use spaces if I use tabs? Also, it seemd like a huge waste of time hitting the space bar so many times…
Why would I use spaces if I use tabs?
To comply with Python’s best practices:
https://peps.python.org/pep-0008/
Also, it seemd like a huge waste of time hitting the space bar so many times…
You use an editor that doesn’t auto-indent?
Removed by mod
I use vi without syntax highlighting.
Removed by mod
Don’t IDEs just replace any tab with 4 spaces anyways? Pretty sure VSCode does
That’s a setting in the editor.
I don’t use an ide, but I wrote a script that replaces any space I type with four.
I haven’t worked out all the use cases yet, though.
I use the tab key but I’m pretty sure vs code converts that to spaces
Depends on your settings, but yeah typically it does
It worries me that a programmer wouldn’t know for sure what’s happening when they hit tab, and that it’s a setting that can be changed.
I mean I was 99% sure it convert to spaces, I cannot say I was certain. The default settings are fine for what I do, I only ever had to change the spacing from 4 to 2 spaces once when dealing with someone else’s files
Linux kernel?
https://www.kernel.org/doc/html/v4.10/process/coding-style.html#indentation
edit: oh python, nevermind
The kernel definitely mixes tabs and spaces:
https://elixir.bootlin.com/linux/latest/source/block/bfq-iosched.c#L390
And in Python, it’s merely a SyntaxCrime.
Are you ok?
gdb ./fuck
r
where
you should get a complete stack trace (complete with values of some function arguments)
puts me in mind of the old guru meditation error messages that popped up in the stone knives and bearskins era of computing.
This C++ message has an urgency vibes to it:
“Segmentation fault!! Drop the Nuclear Reactor quick!!”
Average C++ error

deleted by creator
Where’s rust?
Rust: this garbage code is beneath me, come back when you have your shit together.
Rust required you to fix all the errors before running the code.
Runtime errors are still a thing.
Compared to that trio, they are a rarity that make people excited just to spot one.
Runtime errors are rare? Interesting. I guess it depends on hoe much error handling the dev additionally wants to do.
I have a graphical application that crashes regularly when I switch between displays with Ctrl+alt+number. Something in the winit stack does not like it.
Compilation: top row, runtime: button row.
https://www.youtube.com/@TsodingDaily
If you’re a programmer, or think you might want to be one, I highly recommend this channel. He’s a savant at all sorts of low level things, quite funny and entertaining, and does a fantastic job of explaining what’s going on.
tsoding’s channel is one I look forward to watching every single day, never a dull moment in his streams/videos.
If you’re someone who likes to watch things live, his Twitch channel is available here.
Good gods, a long-form content creator! Will be checking this out later
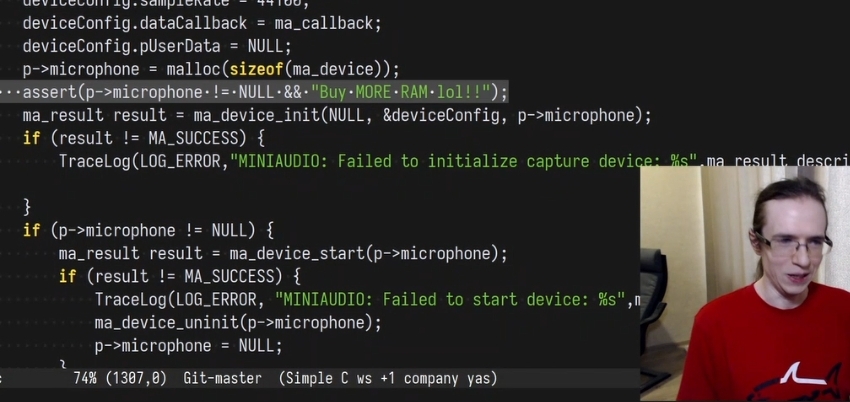
The guy is testing the result of malloc and you are complaining about how?


